# Selecting Data Tracks for Visualization

Partek Flow plots genomic information on the canvas and is organized into horizontal sections called tracks. The exact number, type, and presentation of tracks depend on several factors, such as the underlying pipeline, available annotation, and the level of zoom. The tracks are added, removed, or customized via the **Select tracks** dialog (Figure 1).

<figure><img src="https://documentation.partek.com/download/attachments/3770828/chromosome_select_tracks_button.png?version=1&#x26;modificationDate=1468878454536&#x26;api=v2" alt=""><figcaption><p>Figure 1. Select tracks button opens the Select tracks dialog</p></figcaption></figure>

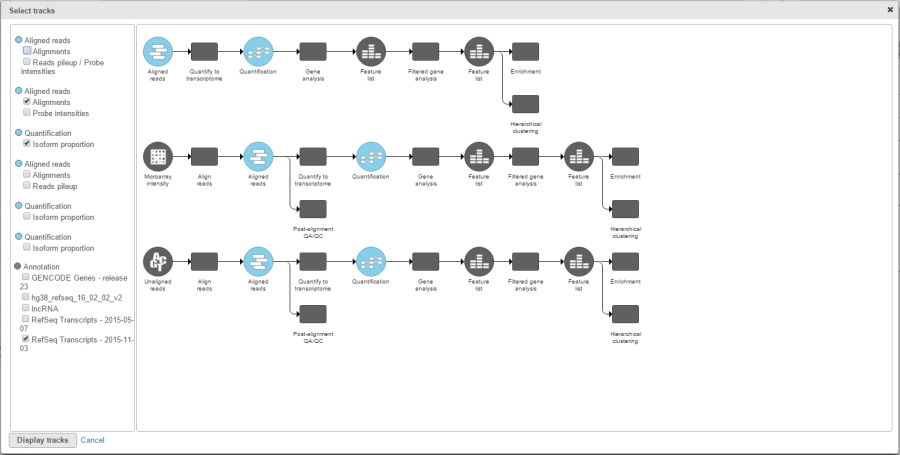
The content of the *Select tracks* dialog depends on the data nodes present on the *Analysis* tab of the current project (an example is shown in Figure 2). Current pipeline is depicted in the center of the window, while data nodes that can be visualised are highlighted by the colour of their layer. Tracks can be turned on or off by selecting the check boxes in the list of possible tracks (and data nodes) on the right. To uncheck all, use the **Clear selection** button.

<figure><img src="https://documentation.partek.com/download/attachments/3770828/chromosome_track_selector.png?version=1&#x26;modificationDate=1468878452024&#x26;api=v2" alt=""><figcaption><p>Figure 2. Select tracks dialog (the pipeline is an example). Data nodes that can be visualised are highlighted by the colour of their layer (sky blue in this example). Tracks can be turned on or off by selecting the check boxes in the list of data nodes and respective tracks (right panel)</p></figcaption></figure>

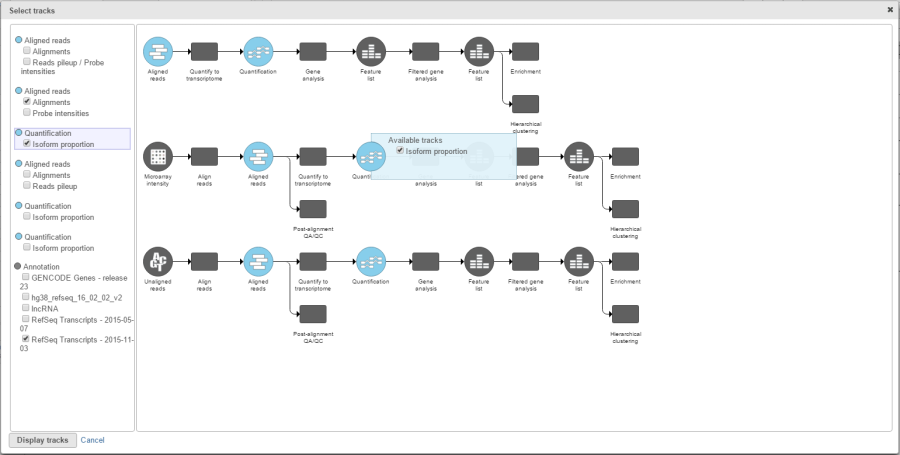
For the ease of use, the pipeline and the list of tracks are linked: hovering over the track list highlights the matching data node in the pipeline and vice versa, i.e. selecting a data node in the pipeline panel highlights the respective node in the track list (Figure 3). Once you decided on the tracks that should be plotted, push **Display tracks** to depict them on the canvas.

\
\\

<figure><img src="https://documentation.partek.com/download/attachments/3770828/chromosome_track_selector_checked.png?version=1&#x26;modificationDate=1468878449338&#x26;api=v2" alt=""><figcaption><p>Figure 3. Selecting data tracks for the visualisation using the Select tracks dialog (an example). Hovering over the track list highlights the matching data node in the pipeline and vice versa, i.e. selecting a data node in the pipeline panel (e.g. Isoform proportion track) highlights the respective node in the track list (Normalised counts and Isoform proportion)</p></figcaption></figure>

## Additional Assistance

If you need additional assistance, please visit [our support page](http://www.partek.com/support) to submit a help ticket or find phone numbers for regional support.


---

# Agent Instructions: Querying This Documentation

If you need additional information that is not directly available in this page, you can query the documentation dynamically by asking a question.

Perform an HTTP GET request on the current page URL with the `ask` query parameter:

```
GET https://help.multiomics.illumina.com/partek/partek-flow/user-manual/visualizations/chromosome-view/selecting-data-tracks-for-visualization.md?ask=<question>
```

The question should be specific, self-contained, and written in natural language.
The response will contain a direct answer to the question and relevant excerpts and sources from the documentation.

Use this mechanism when the answer is not explicitly present in the current page, you need clarification or additional context, or you want to retrieve related documentation sections.